Loupe: a lightweight local tracing dashboard for LLM apps
When you are building with LLMs there is a very annoying tooling gap. At one end you have console.log() and whatever scraps of logging you remembered to add at 1am. At the other end you have full observability stacks built for hosted apps, retained data, team dashboards and production telemetry.
Most of the time, when I am iterating on an agent locally, I do not want either of those things.
I built Loupe for that middle ground. It is a lightweight local tracing dashboard for LLM applications and agent systems. It captures full request and response payloads, streaming chunks, tags and hierarchy context, then serves an inspector UI on 127.0.0.1. There is no database, no containers, no external service and no persistence. Traces live in memory and disappear on restart.
That last part is a feature, not a bug.
The gap Loupe fills
Most tracing tools make sense once you have a system you want to watch over time. They assume storage, ingestion, shared dashboards and infrastructure that sticks around.
That is not the problem I usually have while building.
Usually I am trying to answer much more immediate questions:
- What exact payload did I send to the model?
- What tool arguments did it produce?
- What did the tool return?
- Which actor or stage made this call?
- Did this go through the invoke path or the stream path?
- Why did this run feel slow?
Loupe is aimed squarely at those questions. It gives you just enough structure to understand a local run without dragging in an observability platform.
What the UI gives you
The main view is session-first. You can browse by session, actor and stage, then open conversation, request, response and stream views for any trace. There are raw and formatted JSON modes, live updates over SSE, latency badges and cost rollups when usage and pricing are available.
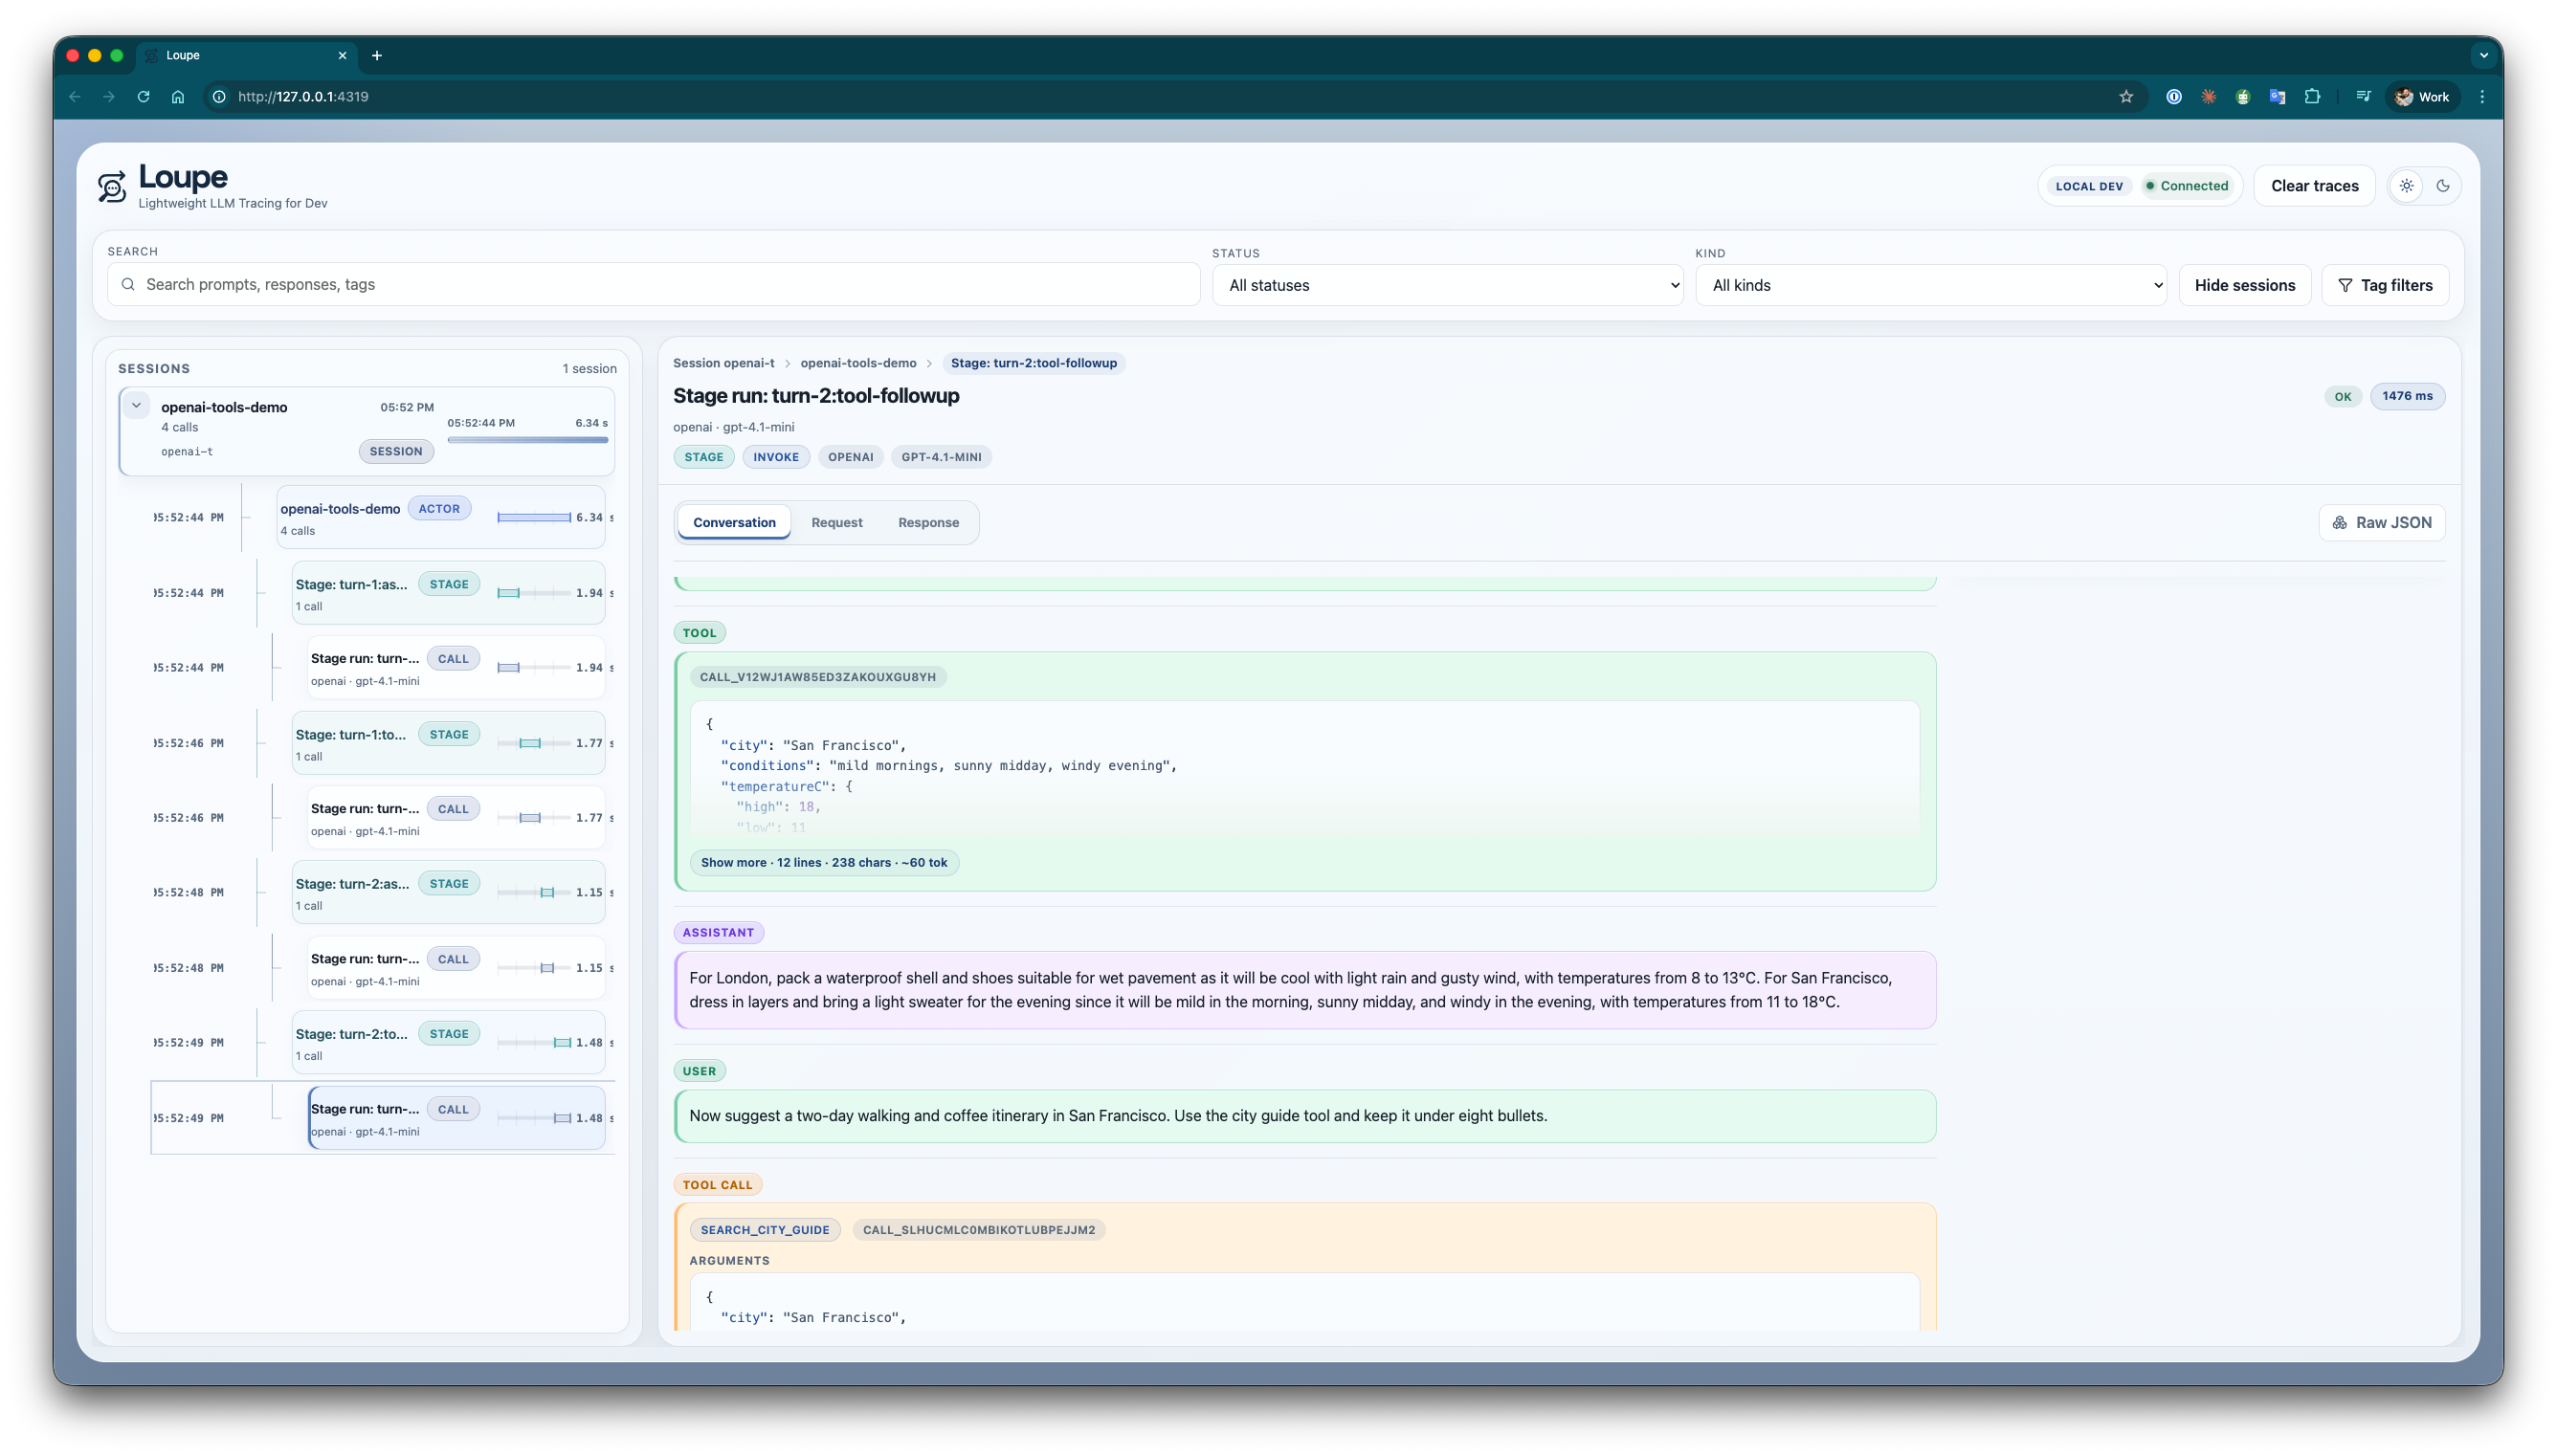
One thing I particularly wanted was to inspect tool-using conversations without mentally stitching together logs from three places. In the conversation view above you can see the user message, assistant response, tool calls, tool results and stage context in one timeline.
If I need to drop down a level, I can open the captured request payload directly:
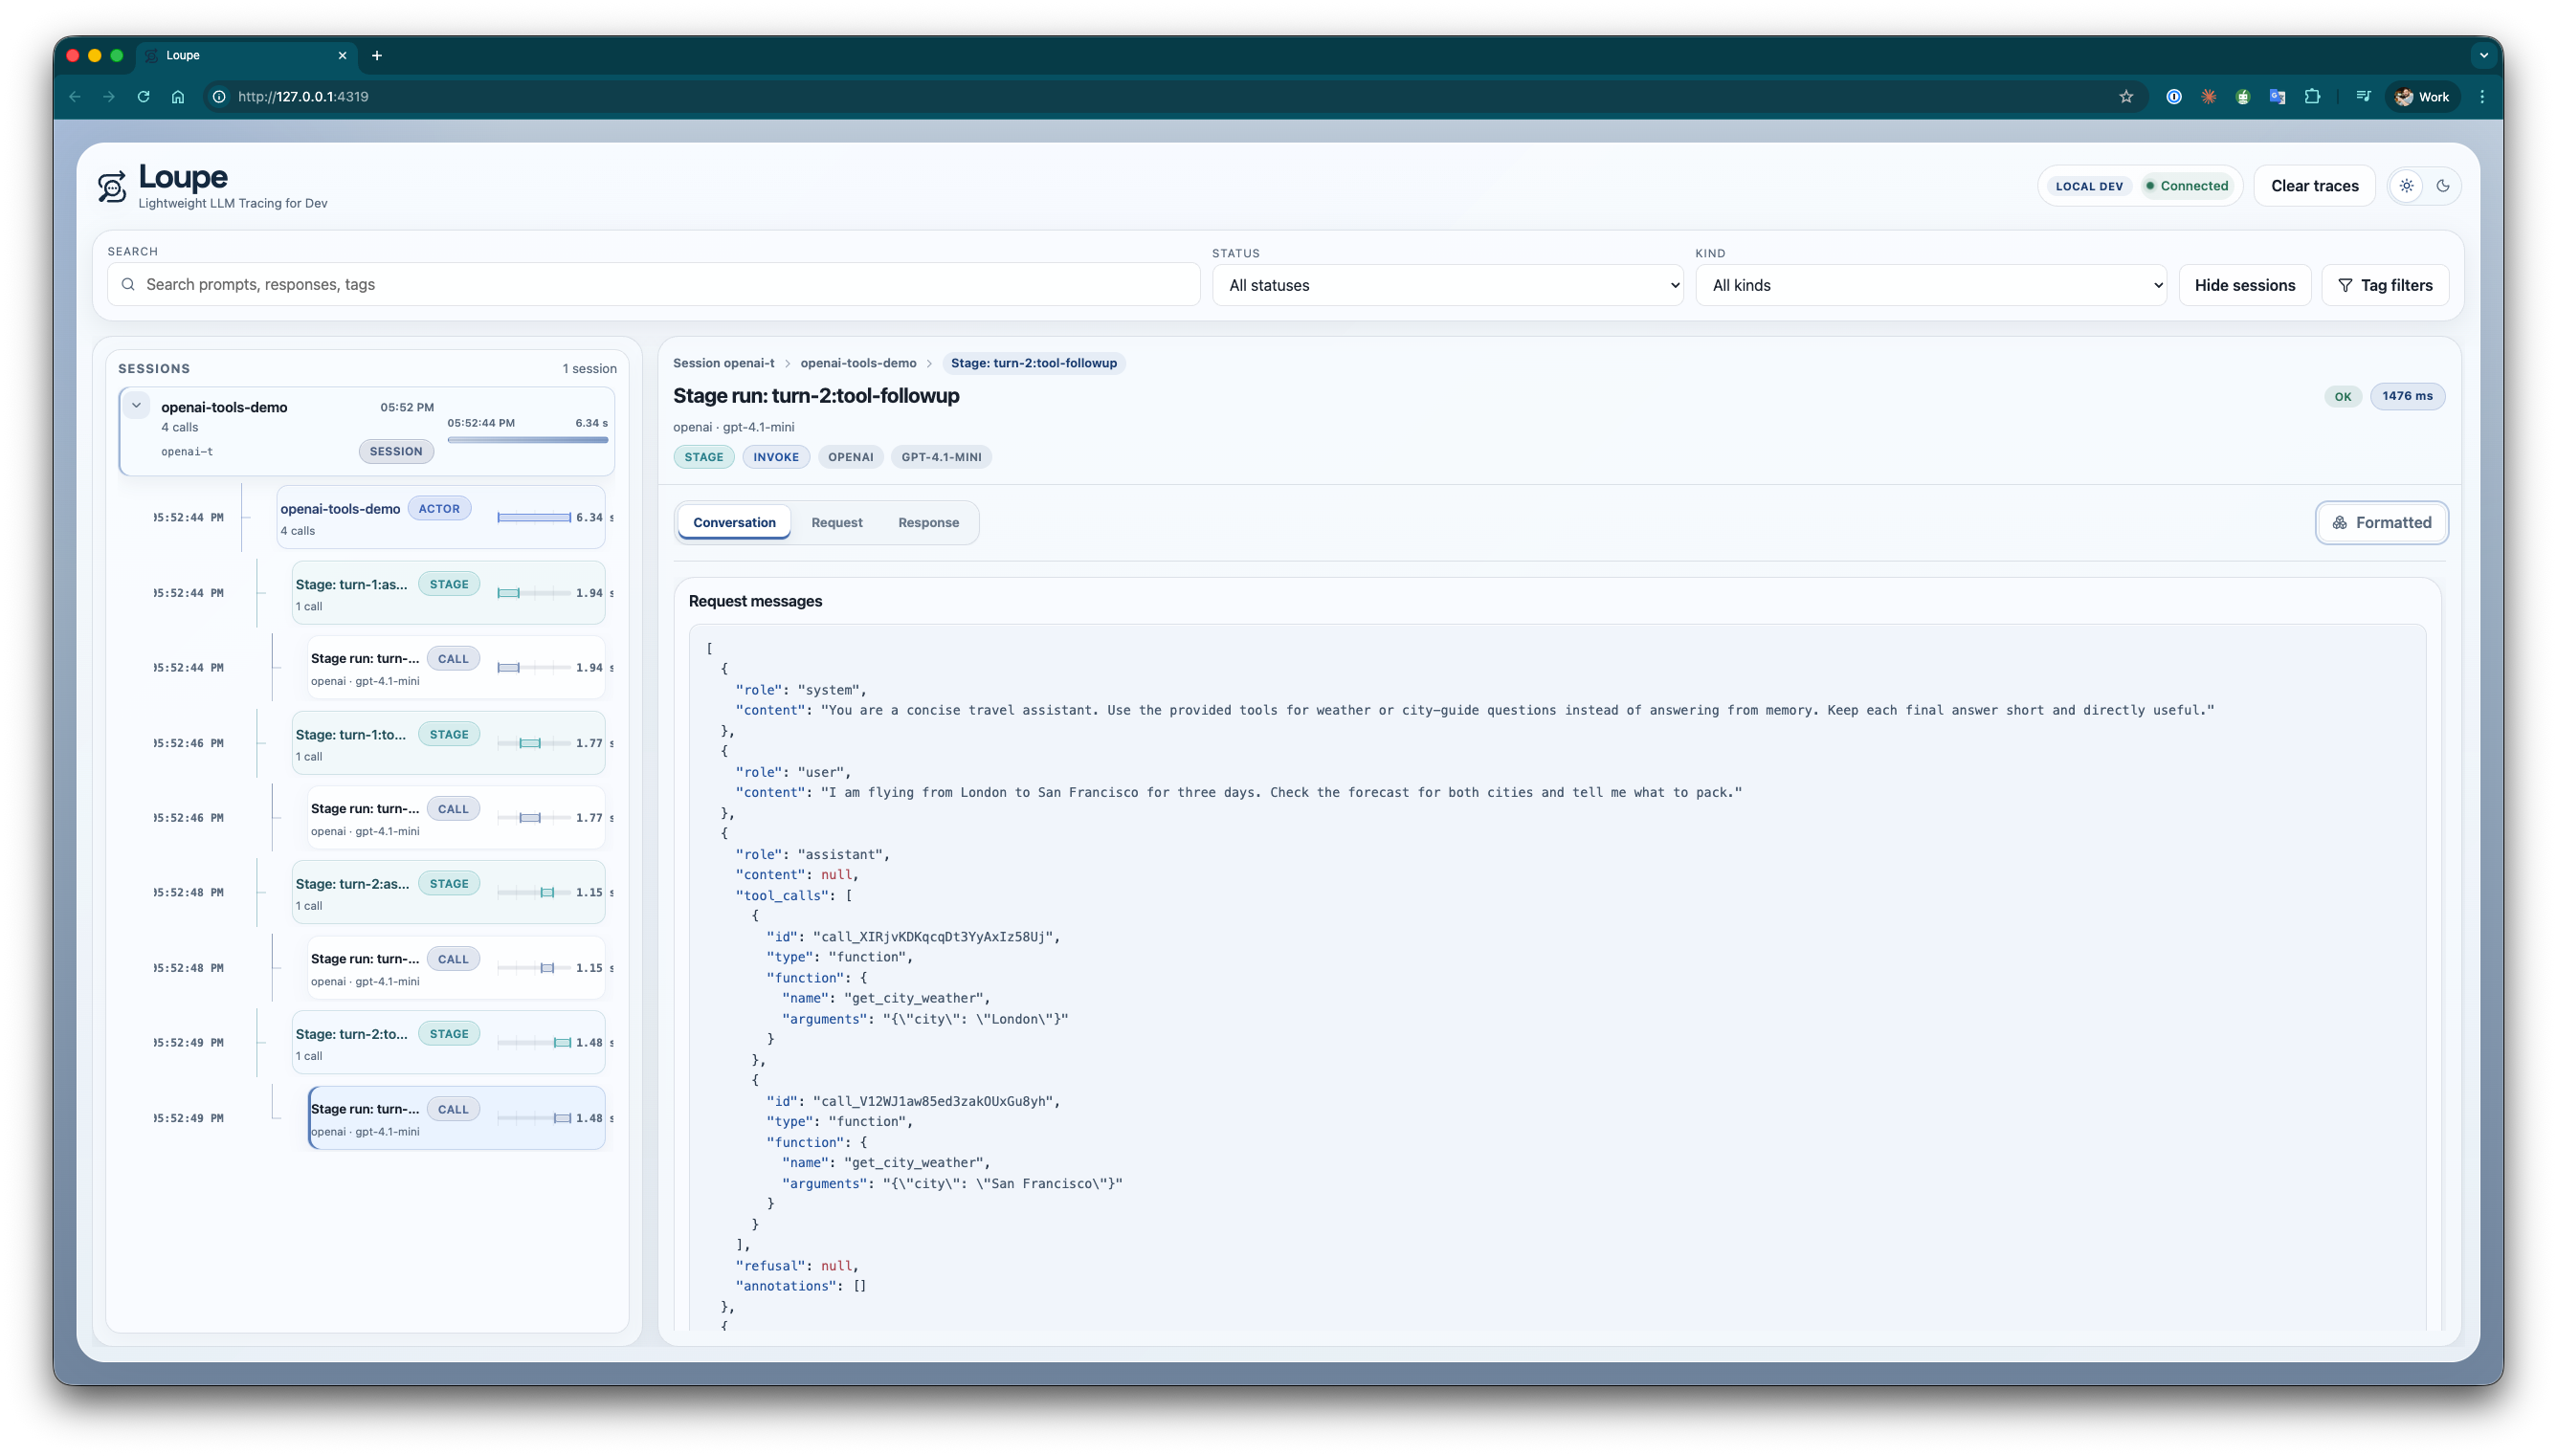
That makes it much easier to answer questions like “did I actually send the system prompt I think I sent?” or “what changed between this run and the last one?”
Getting tracing in quickly
If you are already using the official OpenAI client, the easy path is to wrap it and keep calling it as normal:
npm install @mtharrison/loupe
export LLM_TRACE_ENABLED=1
import { wrapOpenAIClient } from '@mtharrison/loupe';
import OpenAI from 'openai';

const client = wrapOpenAIClient(
  new OpenAI({ apiKey: process.env.OPENAI_API_KEY }),
  () => ({
    sessionId: 'session-123',
    rootSessionId: 'session-123',
    rootActorId: 'support-assistant',
    actorId: 'support-assistant',
    provider: 'openai',
    model: 'gpt-4.1',
    stage: 'answer',
    tags: {
      feature: 'support',
      environment: 'local',
    },
  }),
);

const response = await client.chat.completions.create({
  model: 'gpt-4.1',
  messages: [
    { role: 'user', content: 'Summarise the latest customer notes.' },
  ],
});
On the first recorded trace, Loupe starts a small local server and prints the dashboard URL. If your app already exposes an invoke() and stream() interface there is also a wrapChatModel() helper for that shape.
If you need lower-level control
If your app has its own abstractions already, you can instrument the lifecycle directly:
import {
  getLocalLLMTracer,
  isTraceEnabled,
  recordError,
  recordInvokeFinish,
  recordInvokeStart,
  type TraceContext,
} from '@mtharrison/loupe';

if (isTraceEnabled()) {
  await getLocalLLMTracer().startServer();
}

const context: TraceContext = {
  sessionId: 'session-123',
  rootSessionId: 'session-123',
  rootActorId: 'planner',
  actorId: 'tool-router',
  provider: 'openai',
  model: 'gpt-4.1',
  stage: 'tool-selection',
  tags: {
    environment: 'local',
  },
};

const request = {
  input: {
    messages: [{ role: 'user', content: 'Plan a weekend in Lisbon.' }],
    tools: [],
  },
  options: {},
};

const traceId = recordInvokeStart(context, request);

try {
  const response = await model.invoke(request.input, request.options);
  recordInvokeFinish(traceId, response);
  return response;
} catch (error) {
  recordError(traceId, error);
  throw error;
}
Streaming works the same way. Loupe records each chunk event, first-chunk latency and the reconstructed final response, which is exactly the stuff that tends to get lost in ad-hoc logging.
A few details that matter
- Sensitive headers like
authorizationandx-api-keyare redacted before traces are stored. - Cost rollups work when the model returns usage plus pricing information.
- The hierarchy model is flexible enough for sessions, actors, child actors, stages and guardrails.
- Because everything is local and in-memory, clearing traces is instant and starting over feels cheap.
What Loupe is not
Loupe is intentionally not a production observability platform. It is not a trace database, not a multi-process collector and not a hosted SaaS.
If you need long-term retention or shared dashboards for a team, you should use something else.
But if you feel the jump from console.log() to a full tracing stack is far too big for local development, that is exactly the gap Loupe is meant to fill.